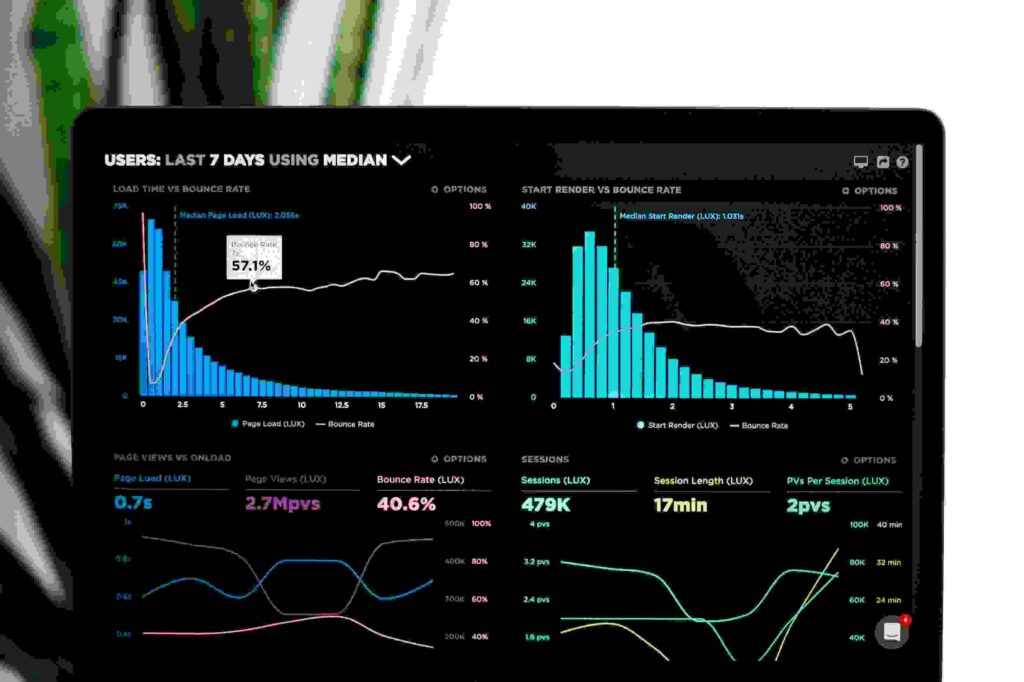
Welcome to the world of data visualization – a dynamic way of presenting complex information in clear, concise and visually appealing formats. In today’s fast-paced business landscape, organizations are spoilt for choice with an abundance of analytical tools at their disposal. However, without effective data visualization techniques, even the most advanced analytics tools can fall short in delivering meaningful insights that drive informed decision-making. In this blog post, we’ll explore how data visualization can be your secret weapon to unlocking actionable insights from your analytical findings. So sit tight and let’s dive into the fascinating world of data visualization.

INTRODUCTION TO DATA VISUALIZATION
Data visualization is the process of taking data and turning it into a graphical representation, such as a chart or graph. It is a way to make complex data more understandable and accessible to everyone.
Data visualization is an important tool for data analysts and scientists because it allows them to see patterns and trends in their data that they might not be able to see otherwise. It can also help them communicate their findings to others who might not be as familiar with the data.
There are many different software programs that can be used for data visualization, but some of the most popular ones are Tableau, Microsoft Excel, and Google Sheets. Each has its own strengths and weaknesses, so it’s important to choose the one that will best meet your needs.
Tableau is a good choice for those who want to create sophisticated visualizations or who need to work with large amounts of data. Excel is a good choice for those who want to create simple visualizations or who are already familiar with using spreadsheets. Google Sheets is a good choice for those who want to share their visualizations online or who need to collaborate with others on their visualizations. No matter which software you choose, there are some basic principles of data visualization that you should keep in mind:
- Keep it simple – don’t try to cram too much information into one visualization.
- Focus on one thing at a time and use multiple visualizations if necessary.Use
WHAT IS DATA ANALYTICS?
Data analytics is the process of analyzing data to find patterns and trends. It can be used to examine past data to answer questions about the present, or to predict future behavior. Data analytics can be applied to any type of data, including financial data, customer data, sales data, web traffic data, and more.
There are many different techniques that can be used fordata analytics. Some common methods include descriptive statistics, regression analysis, time series analysis, and machine learning. Data analytics can be used to answer a variety of business questions, such as “What is the most popular product?” or “What are the biggest drivers of customer satisfaction?”
BENEFITS OF DATA VISUALIZATION
Data visualization is a powerful tool that can help you make sense of your analytical findings. When used correctly, data visualization can help you see patterns and relationships that would otherwise be hidden in the data. It can also help you communicate your findings to others in a clear and concise way.
There are many benefits to using data visualization, including:
1. Data visualization can help you find hidden patterns in your data.
2. Data visualization can help you communicate your findings to others.
3. Data visualization can help you make better decisions.
4. Data visualization can help you understand complex concepts.
5. Data visualization can improve your problem-solving skills.
DIFFERENT TYPES OF DATA VISUALIZATION TOOLS
There are a number of different types of data visualization tools available to help you make sense of your analytical findings. Here are some of the most popular options:
1. Bar charts: Bar charts are one of the most common types of data visualizations. They allow you to compare different data points side-by-side and see how they change over time.
2. Line graphs: Line graphs are another popular type of data visualization. They can be used to track changes in data over time, or to compare different data points against each other.
3. Pie charts: Pie charts are a good way to visualize data that can be divided into categories. For example, if you want to see how your sales are divided up by product category, a pie chart would be a good choice.
4. scatter plots: Scatter plots are a great way to visualize relationships between two variables. For example, if you want to see how customer satisfaction ratings correlate with customer retention rates, a scatter plot would be a good choice.
CONCLUSION
Data visualization is a powerful tool that can help businesses make sense of their analytical findings and gain actionable insights. With data visualizations, businesses can easily identify trends in their data and quickly create effective strategies for achieving desired outcomes. By leveraging the power of data visualizations, organizations can more accurately predict customer activity and optimize business decisions accordingly. Ultimately, data visualization is an essential component to any successful analytics project, enabling businesses to make better decisions with greater clarity into the future.